The home page of ACT is comprised of two parts: the input module and a brief introduction. Before running an ACT task, users should first select species ("Human" or "Mouse") from the pulldown menu (1), multiple tissue types from the hierarchical tree of tissues (2), a list of ordered differentially up-regulated genes (DUGs) for cell clusters as input (3), and WISE further combined with GSEA if choosing the "GSEA" box (4) in the input module. Upon clicking the "Submit" button, an ACT task is performed, and a unique ID will be assigned, by which the annotation results can be retrieved (5). On the right, a concise overview is written to introduce ACT to users and list key features (6).
Please note that if you encounter an error during the ACT execution process, you will be redirected to the "Help page". At this point, please check whether the error is due to the provided format of the ordered up-regulated genes (DUGs).
1) As indicated in our instructions on the input module (3), all inputs must be in English, and genes and cluster names must be connected using English colons.
2) Cluster names should only contain numbers, letters, and underscores, while marker genes must be separated by English commas.
3) Additionally, we recommend providing 30 genes for each cluster. If there are too few genes in some clusters (e.g., only 2 or fewer genes in some clusters), you may encounter an error.
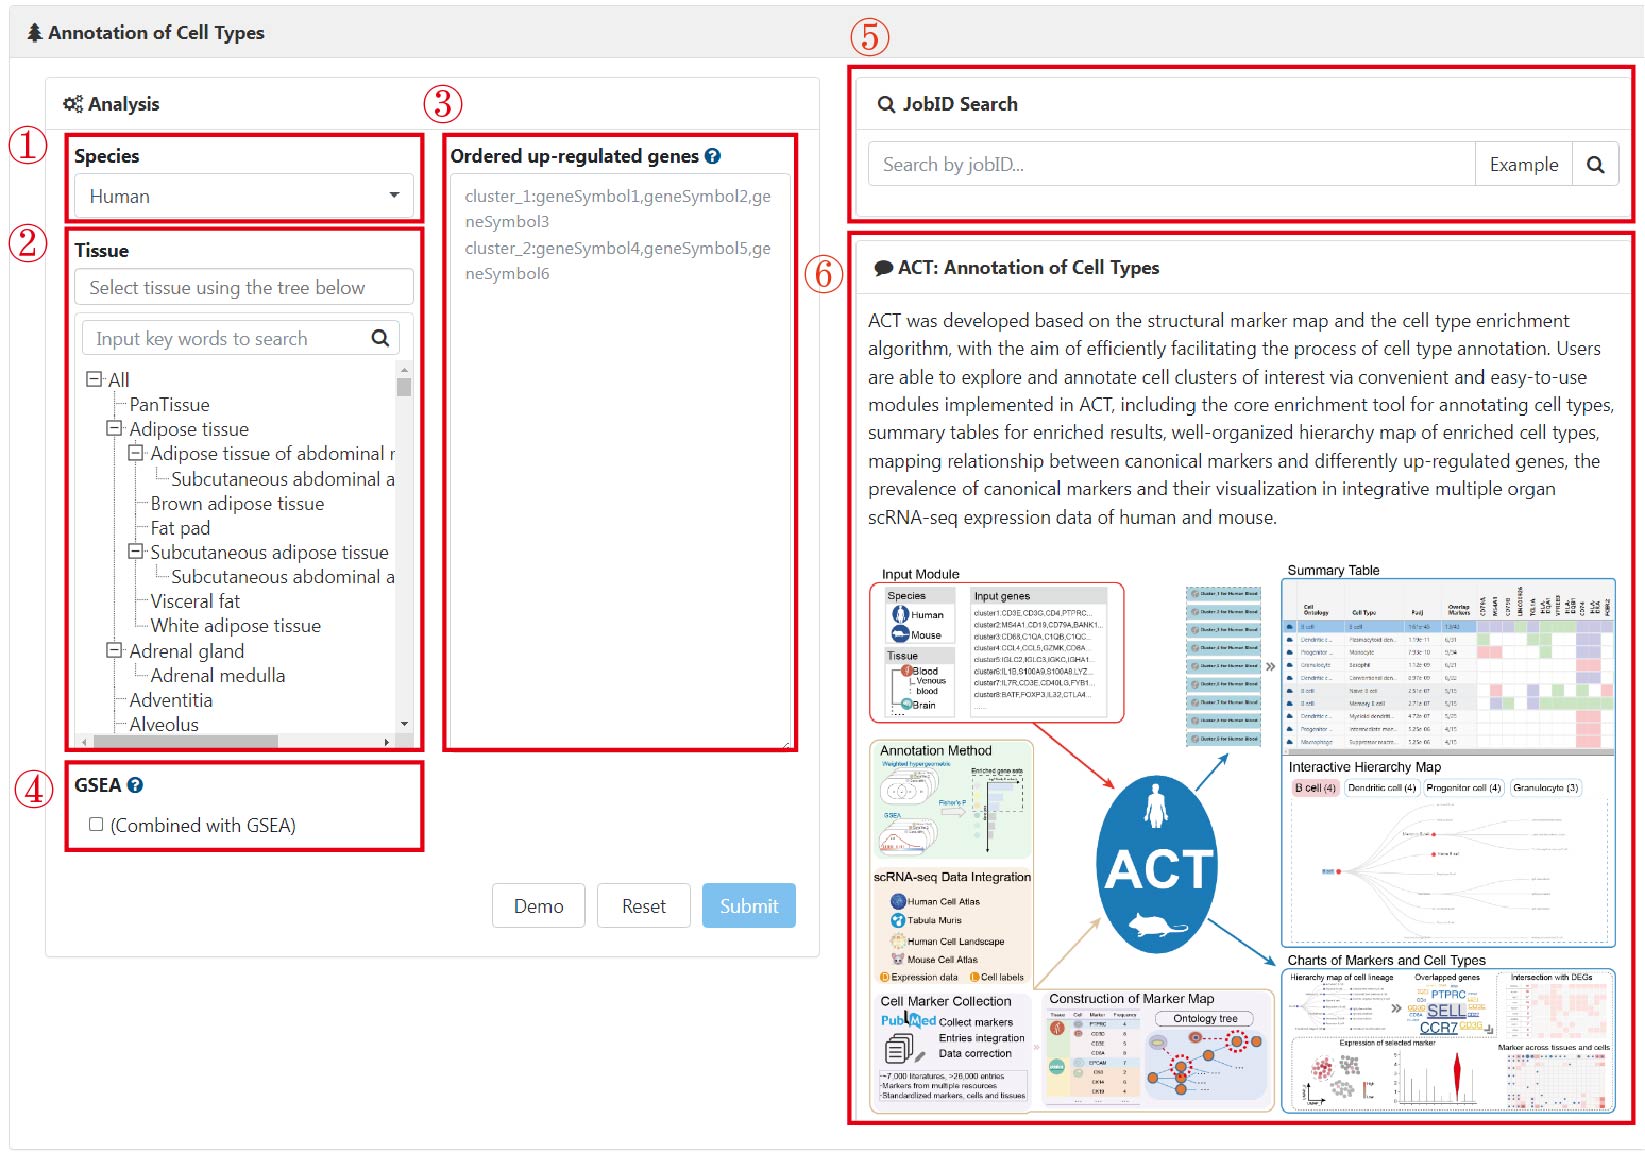
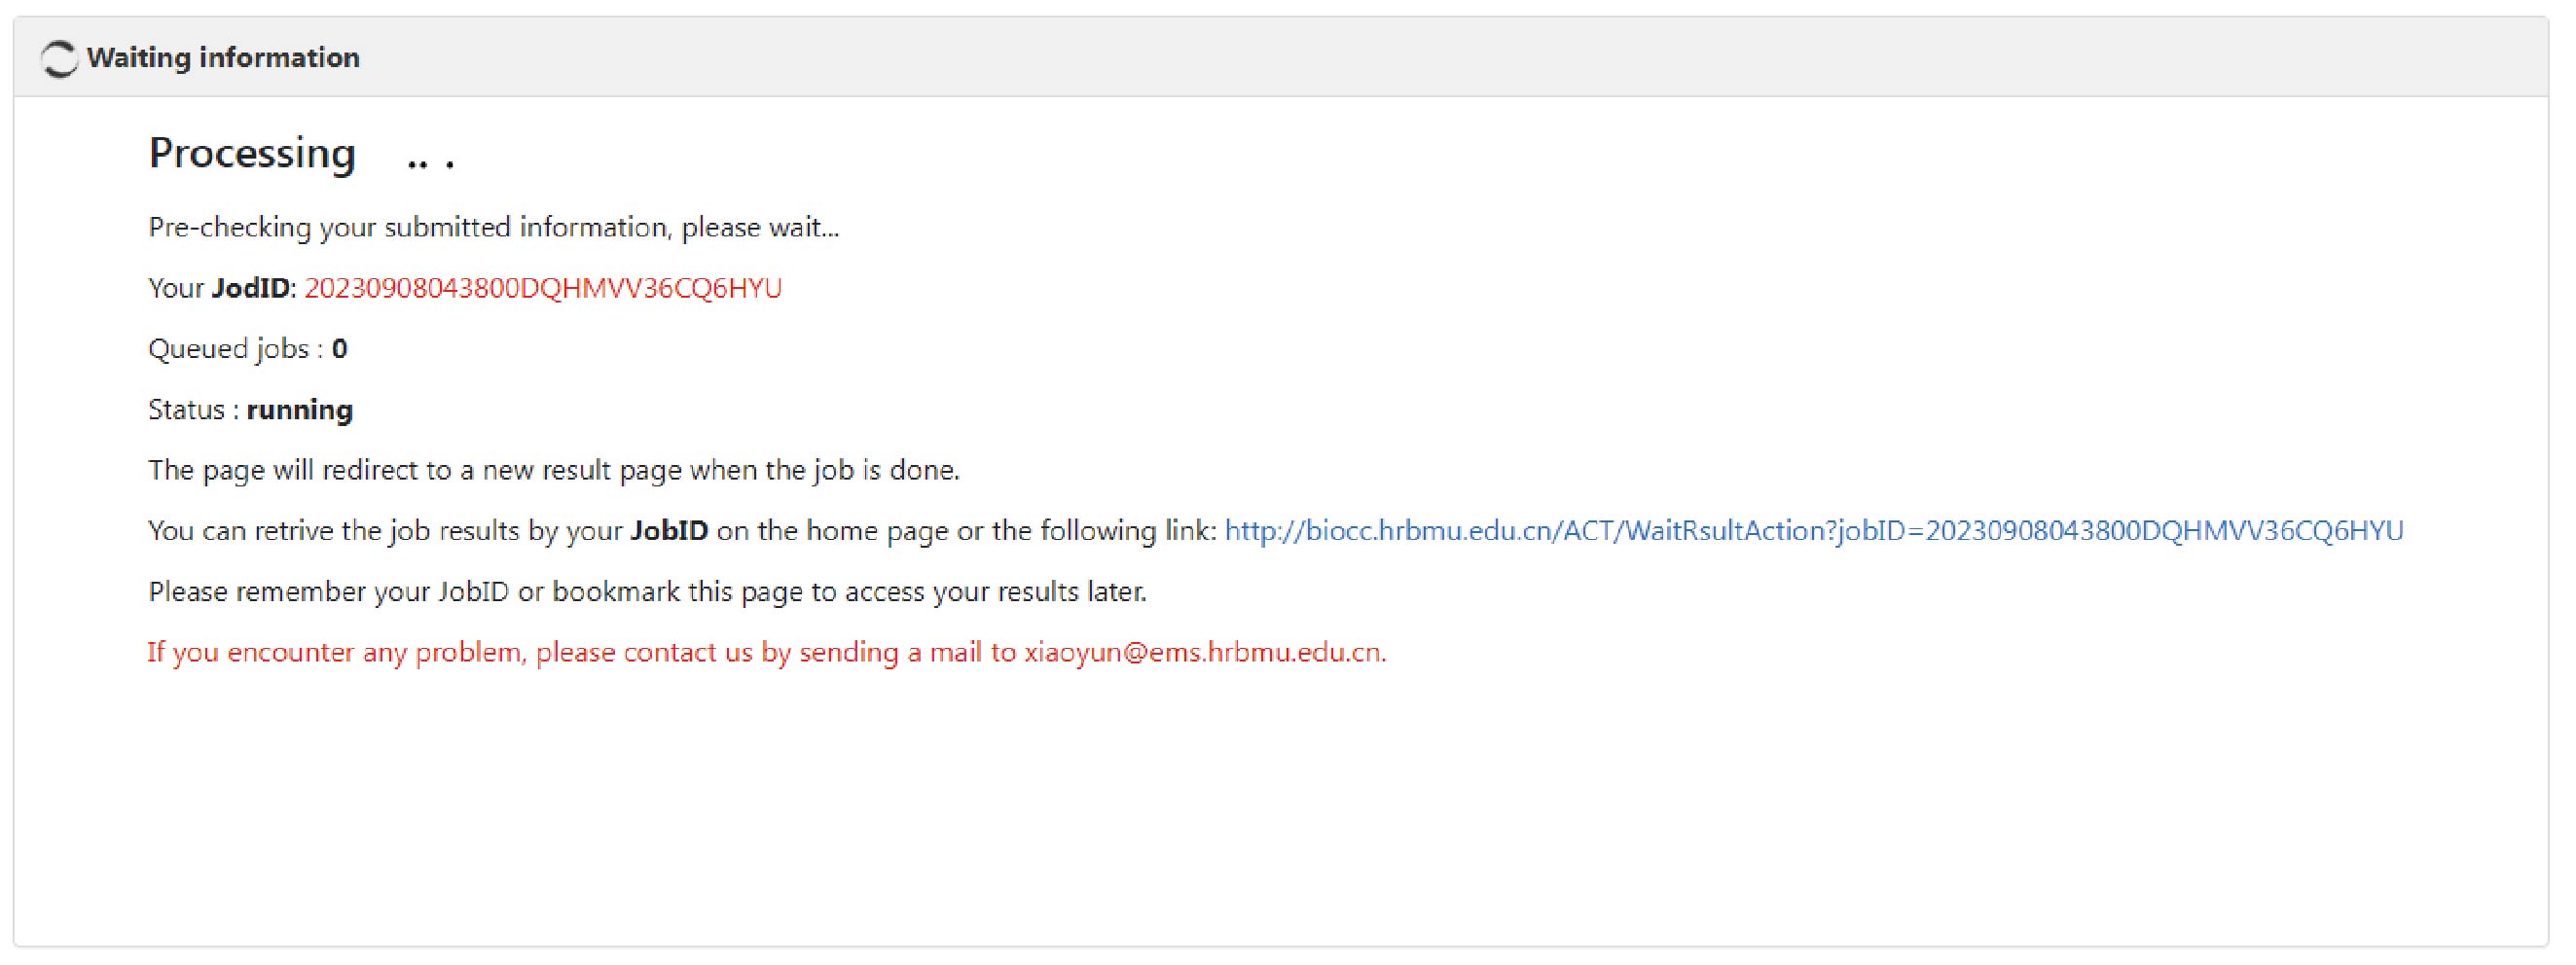
ACT takes the queuing mechanism, and a new task won’t start until the previous task is finished. For an ACT task, a unique ID is assigned, and users can retrieve the annotation results by inputting the corresponding ID in the "JobID Search" box.
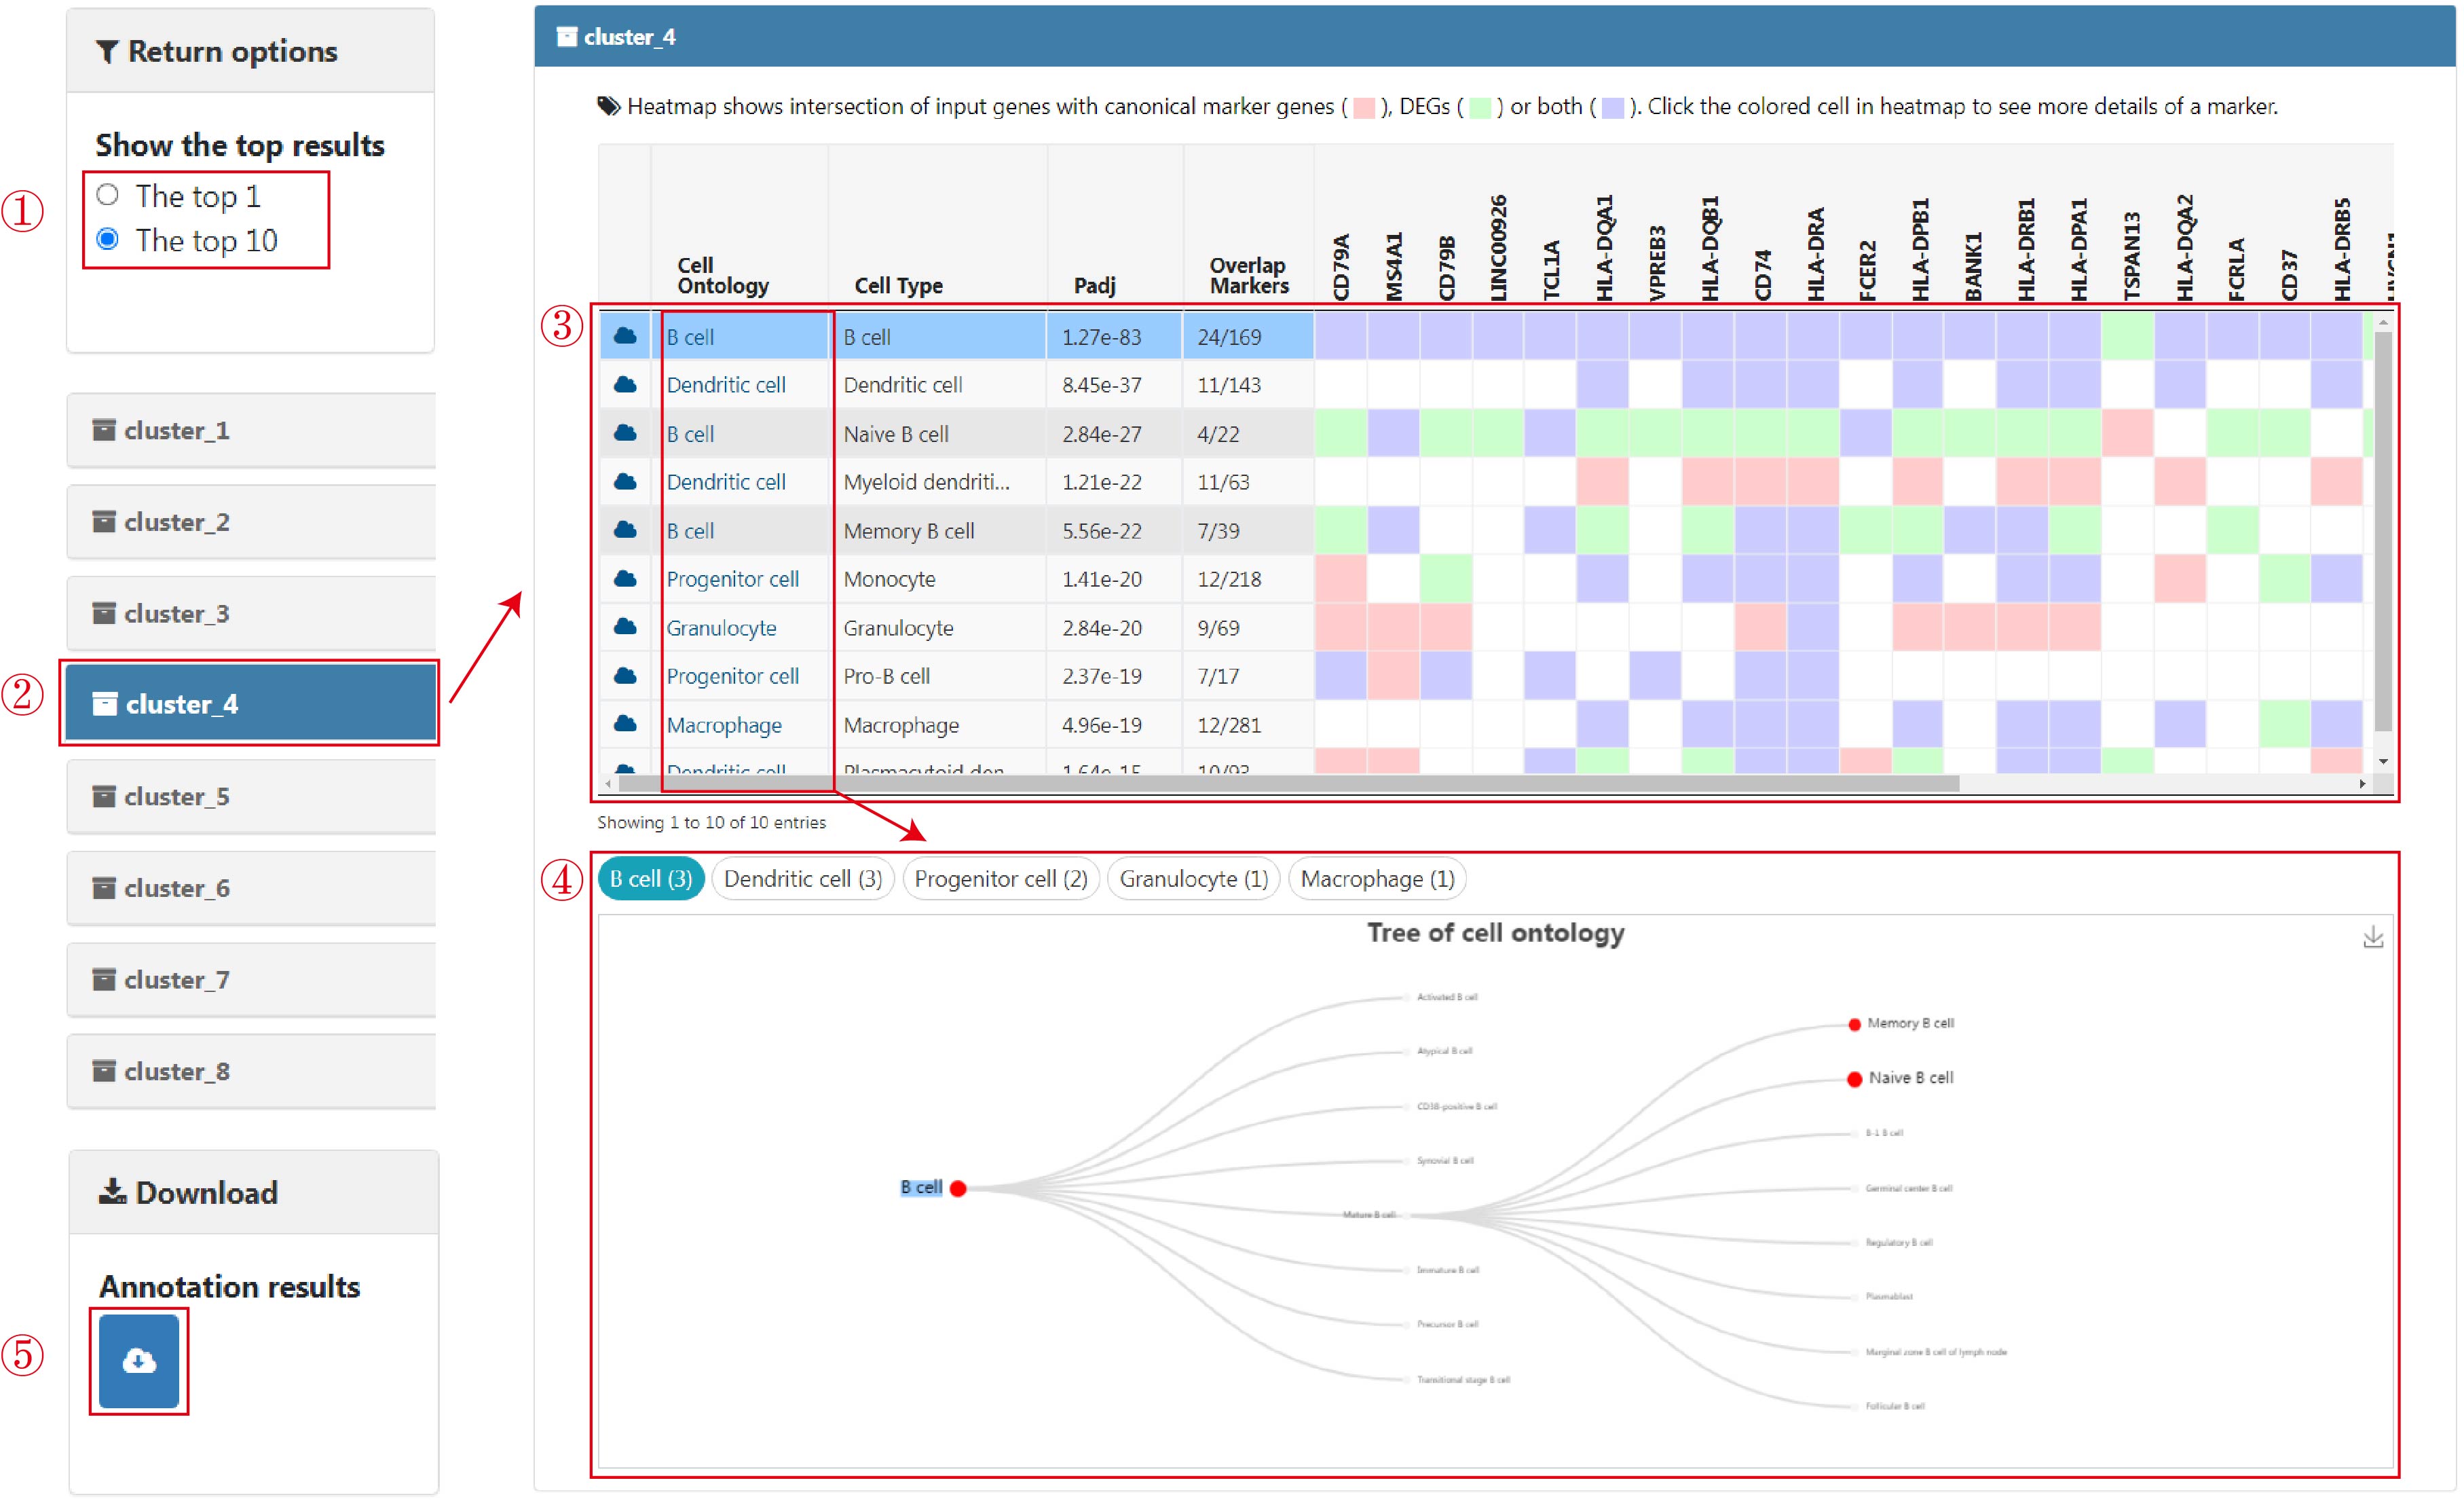
The main result page is displayed as a list of collapsible title bars. The most significantly enriched cell type (top 1) is displayed by default. The top ten annotation results for each cluster can also be alternately obtained (1). Each title bar matches the annotation results for each input gene list, and all of the bars except the first are folded in default. When the cluster bar of interest is clicked, the corresponding annotation results are displayed (2). On the result page of each collapsible title bar, the main summary table, comprising the well-tabulated statistics and an embedded heatmap, was positioned on the top (3). To obtain an overview of enriched cell types, entries, and statistics are mainly presented in a summary table ("Summary Table"), including information on cell types (column "Cell Type") and corresponding lineages (column "Cell Ontology"), Benjamini–Hochberg-corrected P values (column "Padj", q values), numbers of overlapped genes between the input up-regulated genes and cell-type markers (column "Overlap Markers"), and an embedded heatmap (genes in the columns are of the same order as user-input genes) showing the intersection of input up-regulated genes with canonical marker genes (red), cell-type-specific DEGs (green) or both (purple). Each row of the summary table/heatmap is for one enriched cell type. The tabulated list is arranged in ascending order according to the significance (column "Padj"), where only up to 10 entries are displayed, and all results can be downloaded. In practice, the most significant enriched cell type (top 1) for each cell cluster is selected as the preferred cell type label.
When clicking the cell lineages in the summary table, the tree will automatically switch among cell lineages, and the selected item is also highlighted (4). These tree views provide users with a global perspective to compare the enriched cell types at different resolution levels. The color, size, and label size of nodes in the cell lineage trees are set according to the rank of the adjusted P-values in ascending order. In addition, all annotation results can be downloaded by clicking the download button (5).
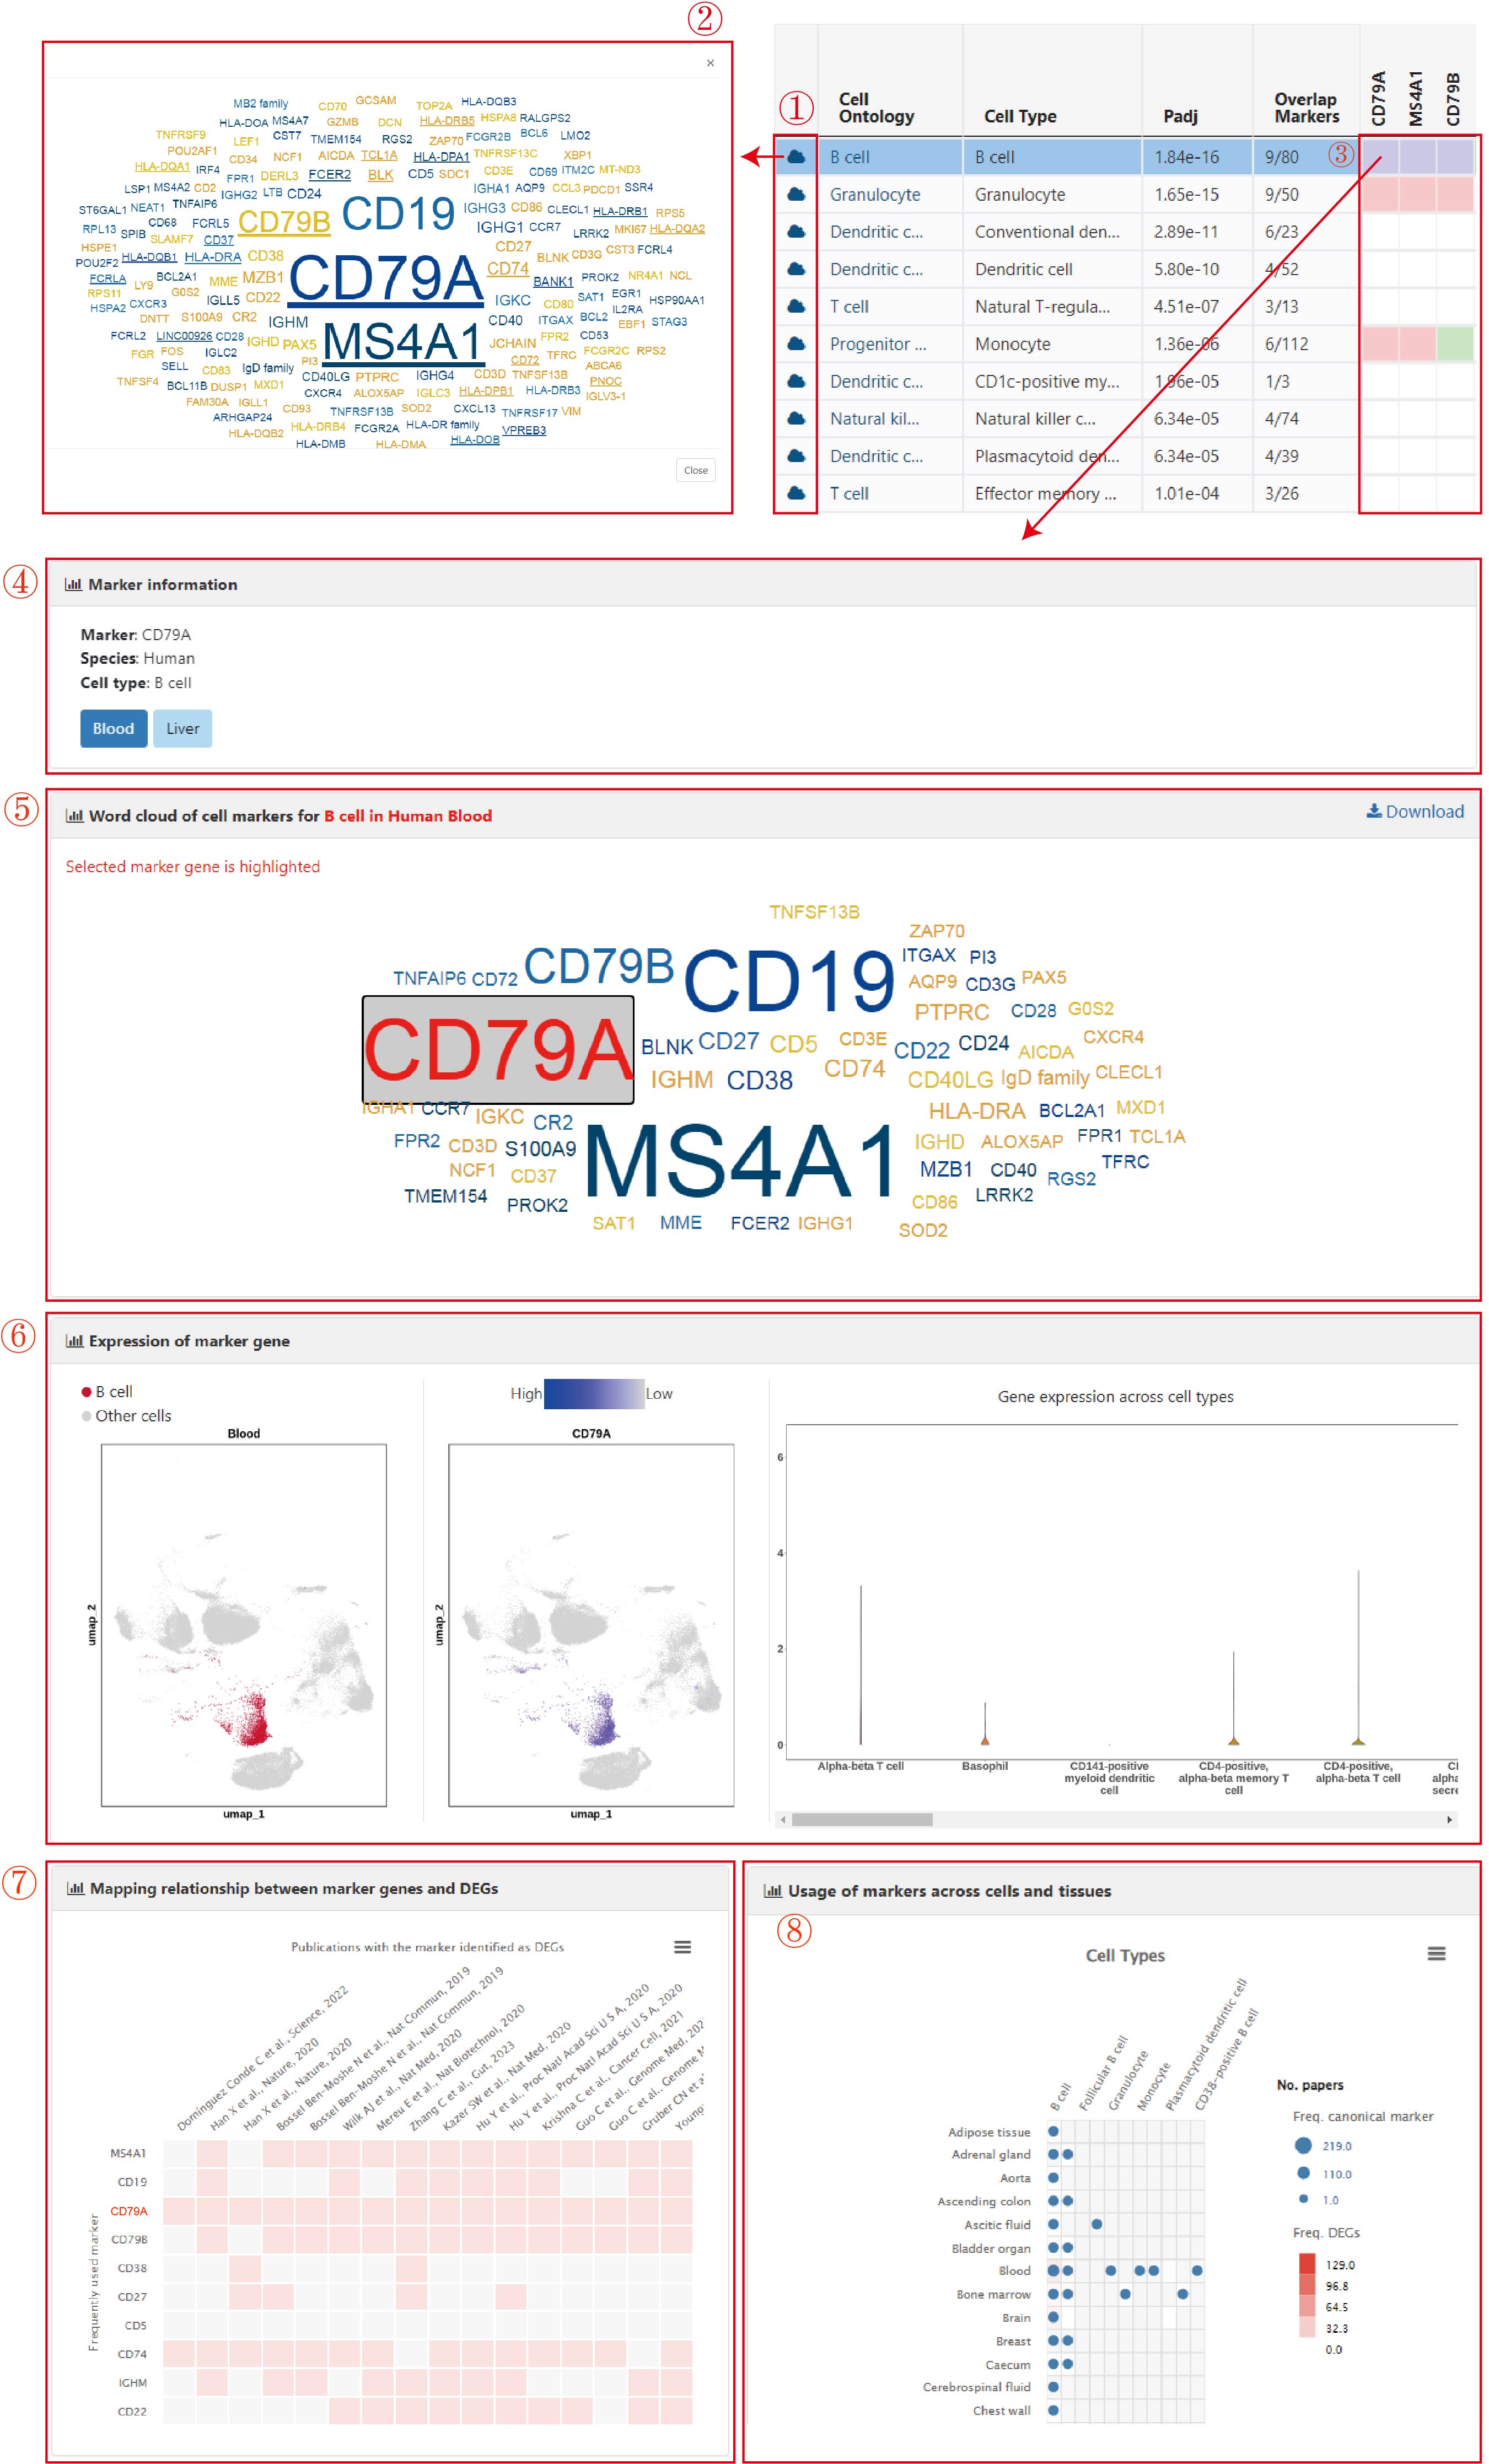
To provide detailed and comprehensive information for understanding the characteristics of cell types and markers, ACT offers a series of charts for cell types and markers. After clicking the "cloud" icon at the beginning of an enriched cell type, a pop-up window with a word cloud was presented (1). In the word cloud, the size of genes indicated the usage frequency of markers for the selected tissues, and marker genes overlapping with the input genes were underlined.
Further, by clicking the colored cells (i.e., the input up-regulated genes) in the heatmap of the summary table, five panels used to characterize the selected markers in specific cell types are shown. The first panel shows the basic information (marker of interest, species, cell type, and the tissue(s)) in which users can click one tissue to get more details about the selected marker (4). The next two panels show a word cloud with a highlighted background of marker and UMAP and violin plots of the expression of marker for the cell type in the clicked tissue (5-6). Besides, the intersection between the top 10 (at most) frequently used markers and cell-type-specific DEGs, together with the usage frequency of markers, was designed to characterize cell types and verify the credibility of markers (7). When hovering on these colored cells, the rank of the selected genes is displayed. The last panel (bubble chart) gives whether the selected canonical marker could also be used as a marker gene in a broad range of tissues and cell types (8).
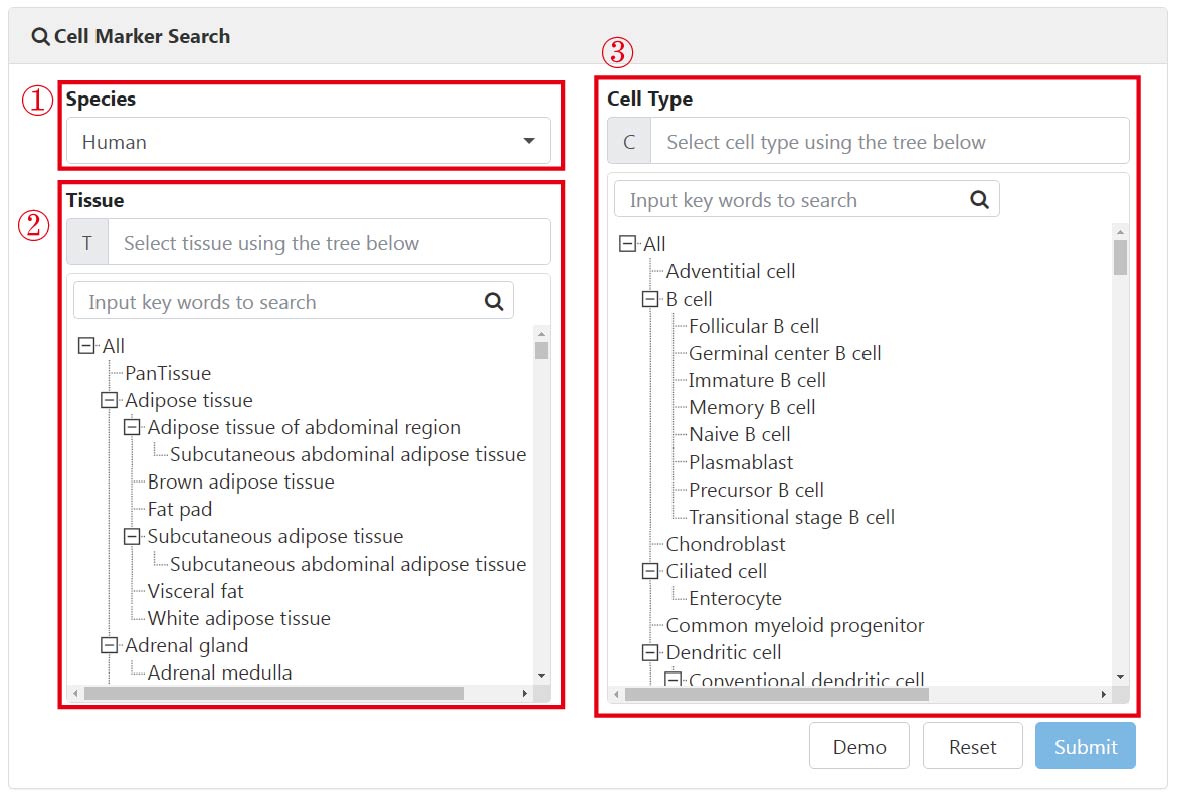
In this module, users can search markers specific to a given cell type by selecting the species ("Human" or "Mouse") from the dropdown menu (1), tissue type from the hierarchical tree of tissues (2), and cell type from the hierarchical tree of cells (3). Upon clicking the "Submit" button, the Results will be displayed.
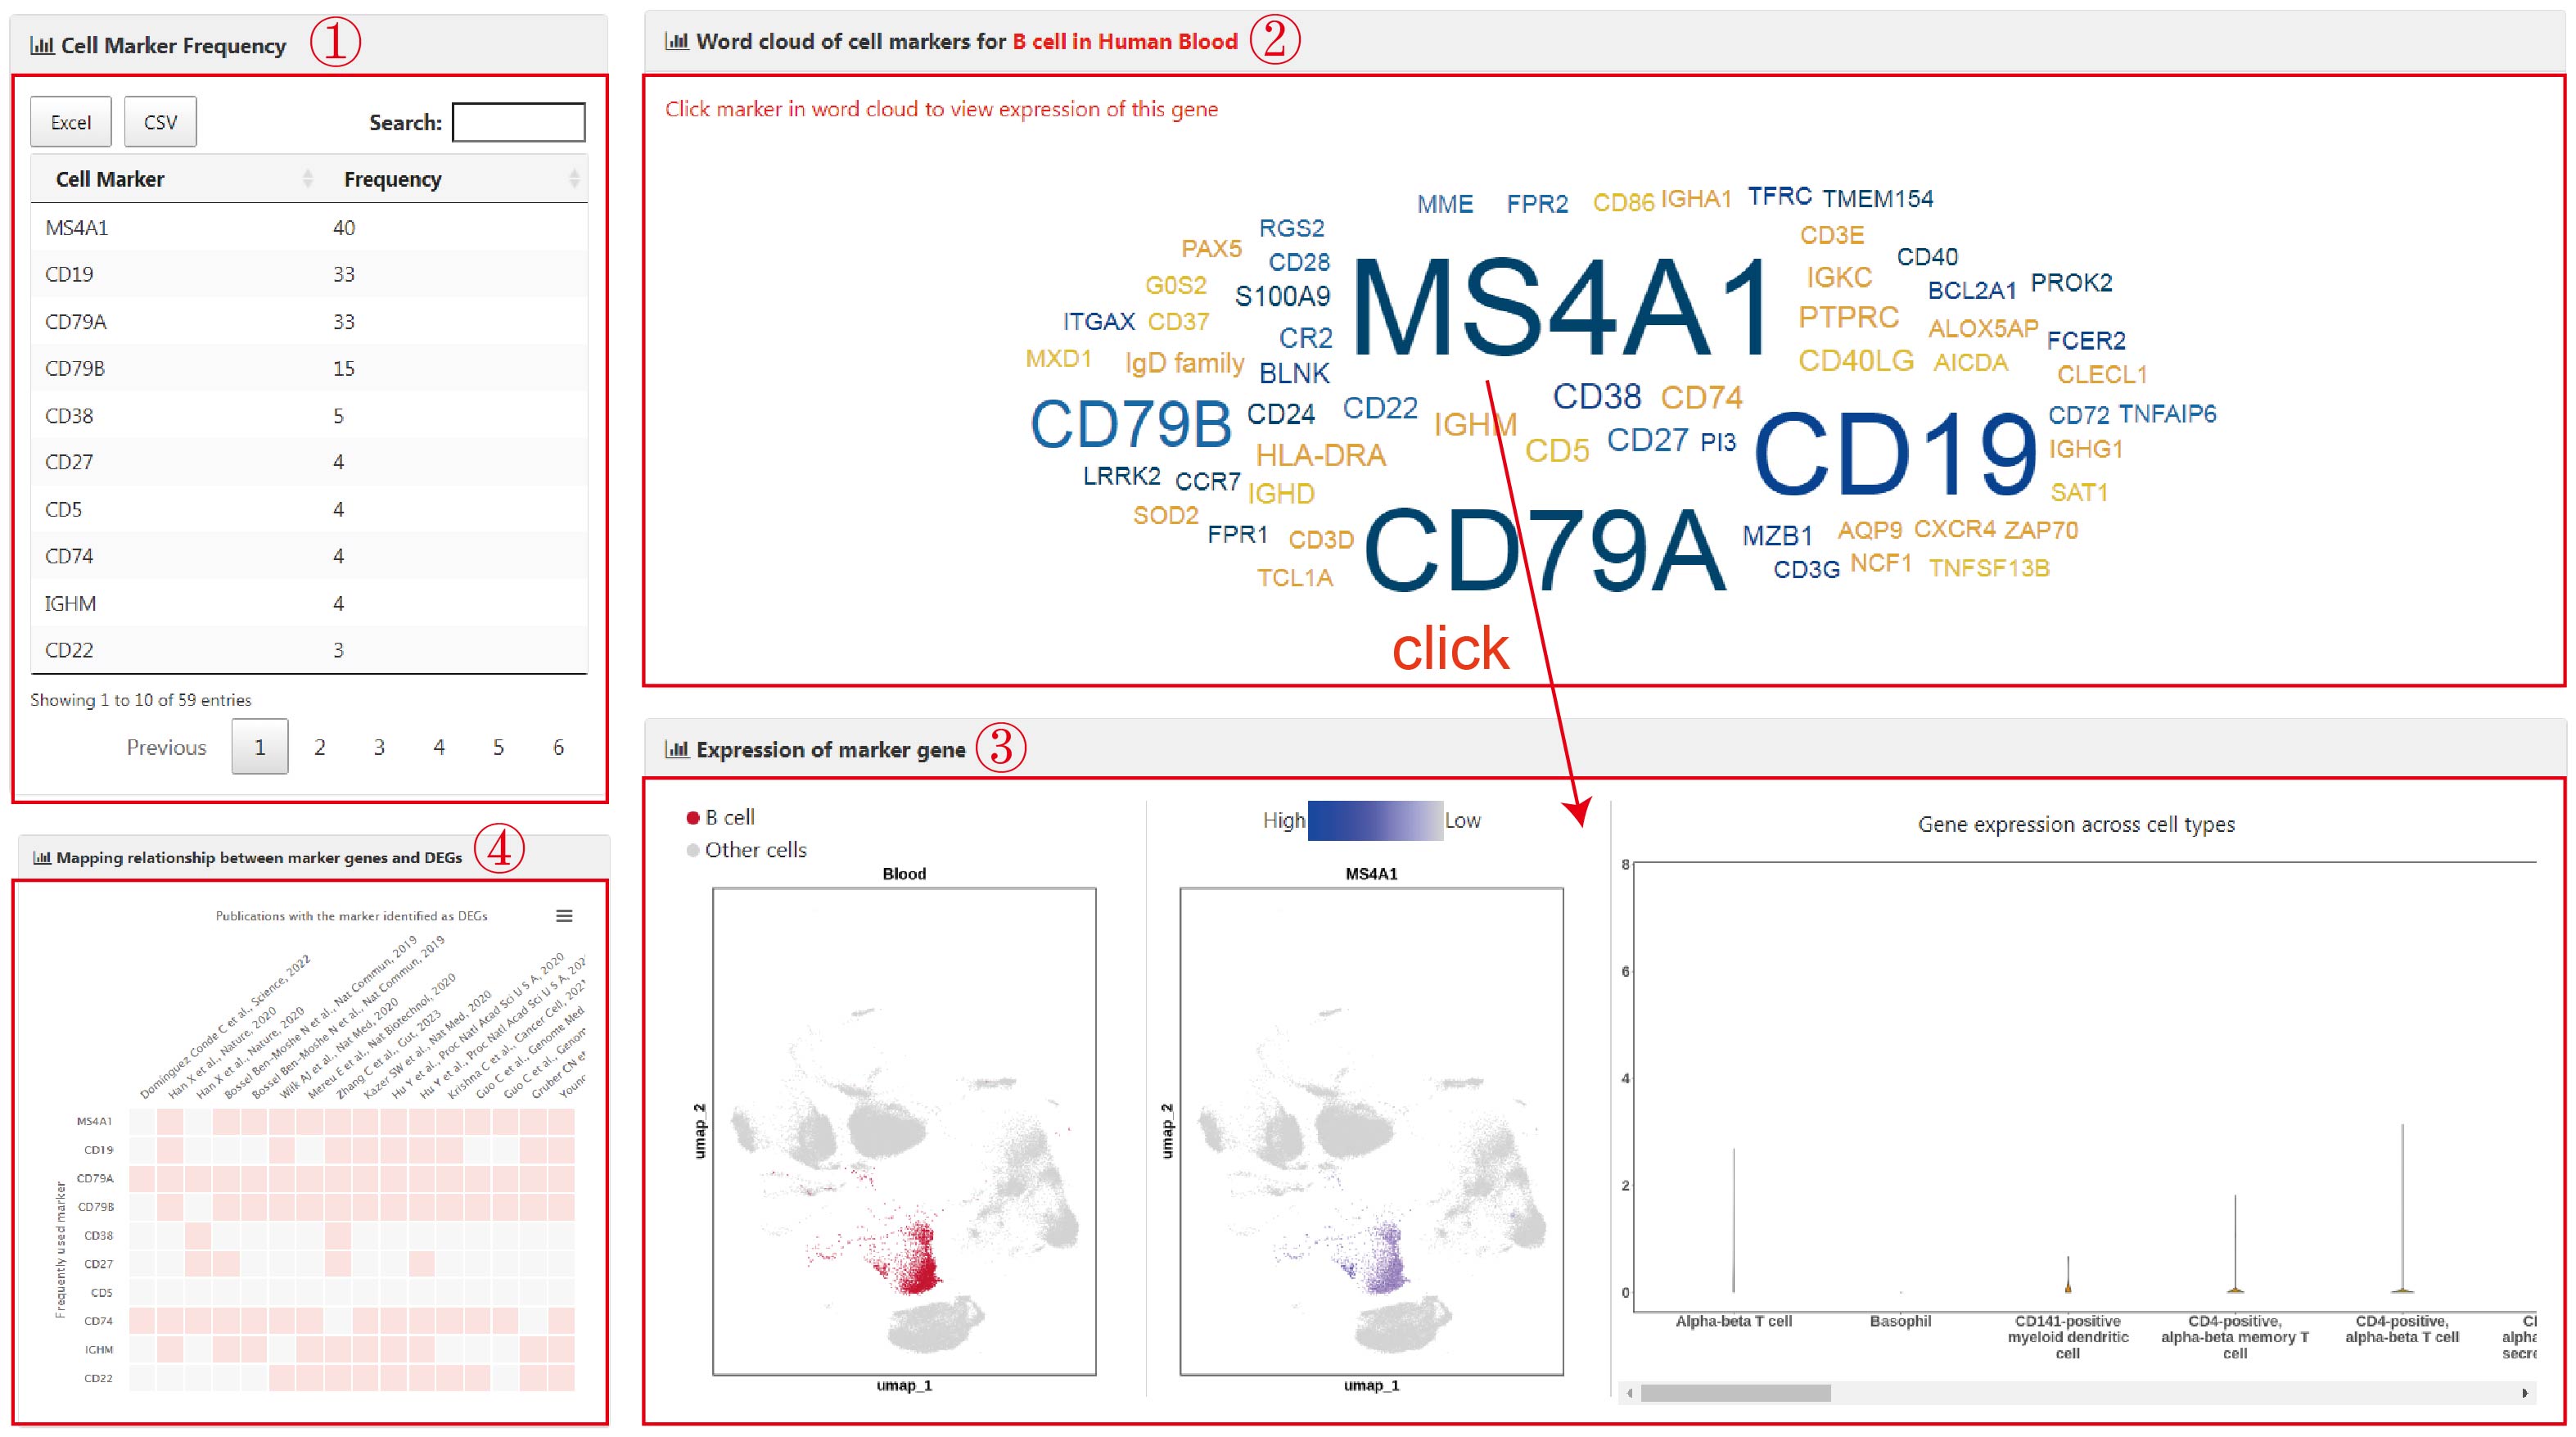
The search results comprise a table presenting the usage frequency of canonical markers (1) and an accompanying intuitive statistical graph depicting cell marker prevalence in the form of a word cloud (2). Users can interactively switch between UMAP and violin plots illustrating the expression of marker genes to confirm whether the selected gene is specifically expressed in the corresponding cell type of a specific tissue (3). Additionally, the intersection between the top 10 (at most) frequently used markers, cell-type-specific DEGs, and marker usage frequency was designed to characterize cell types (4). When hovering over these colored cells, the rank of the selected genes is displayed.
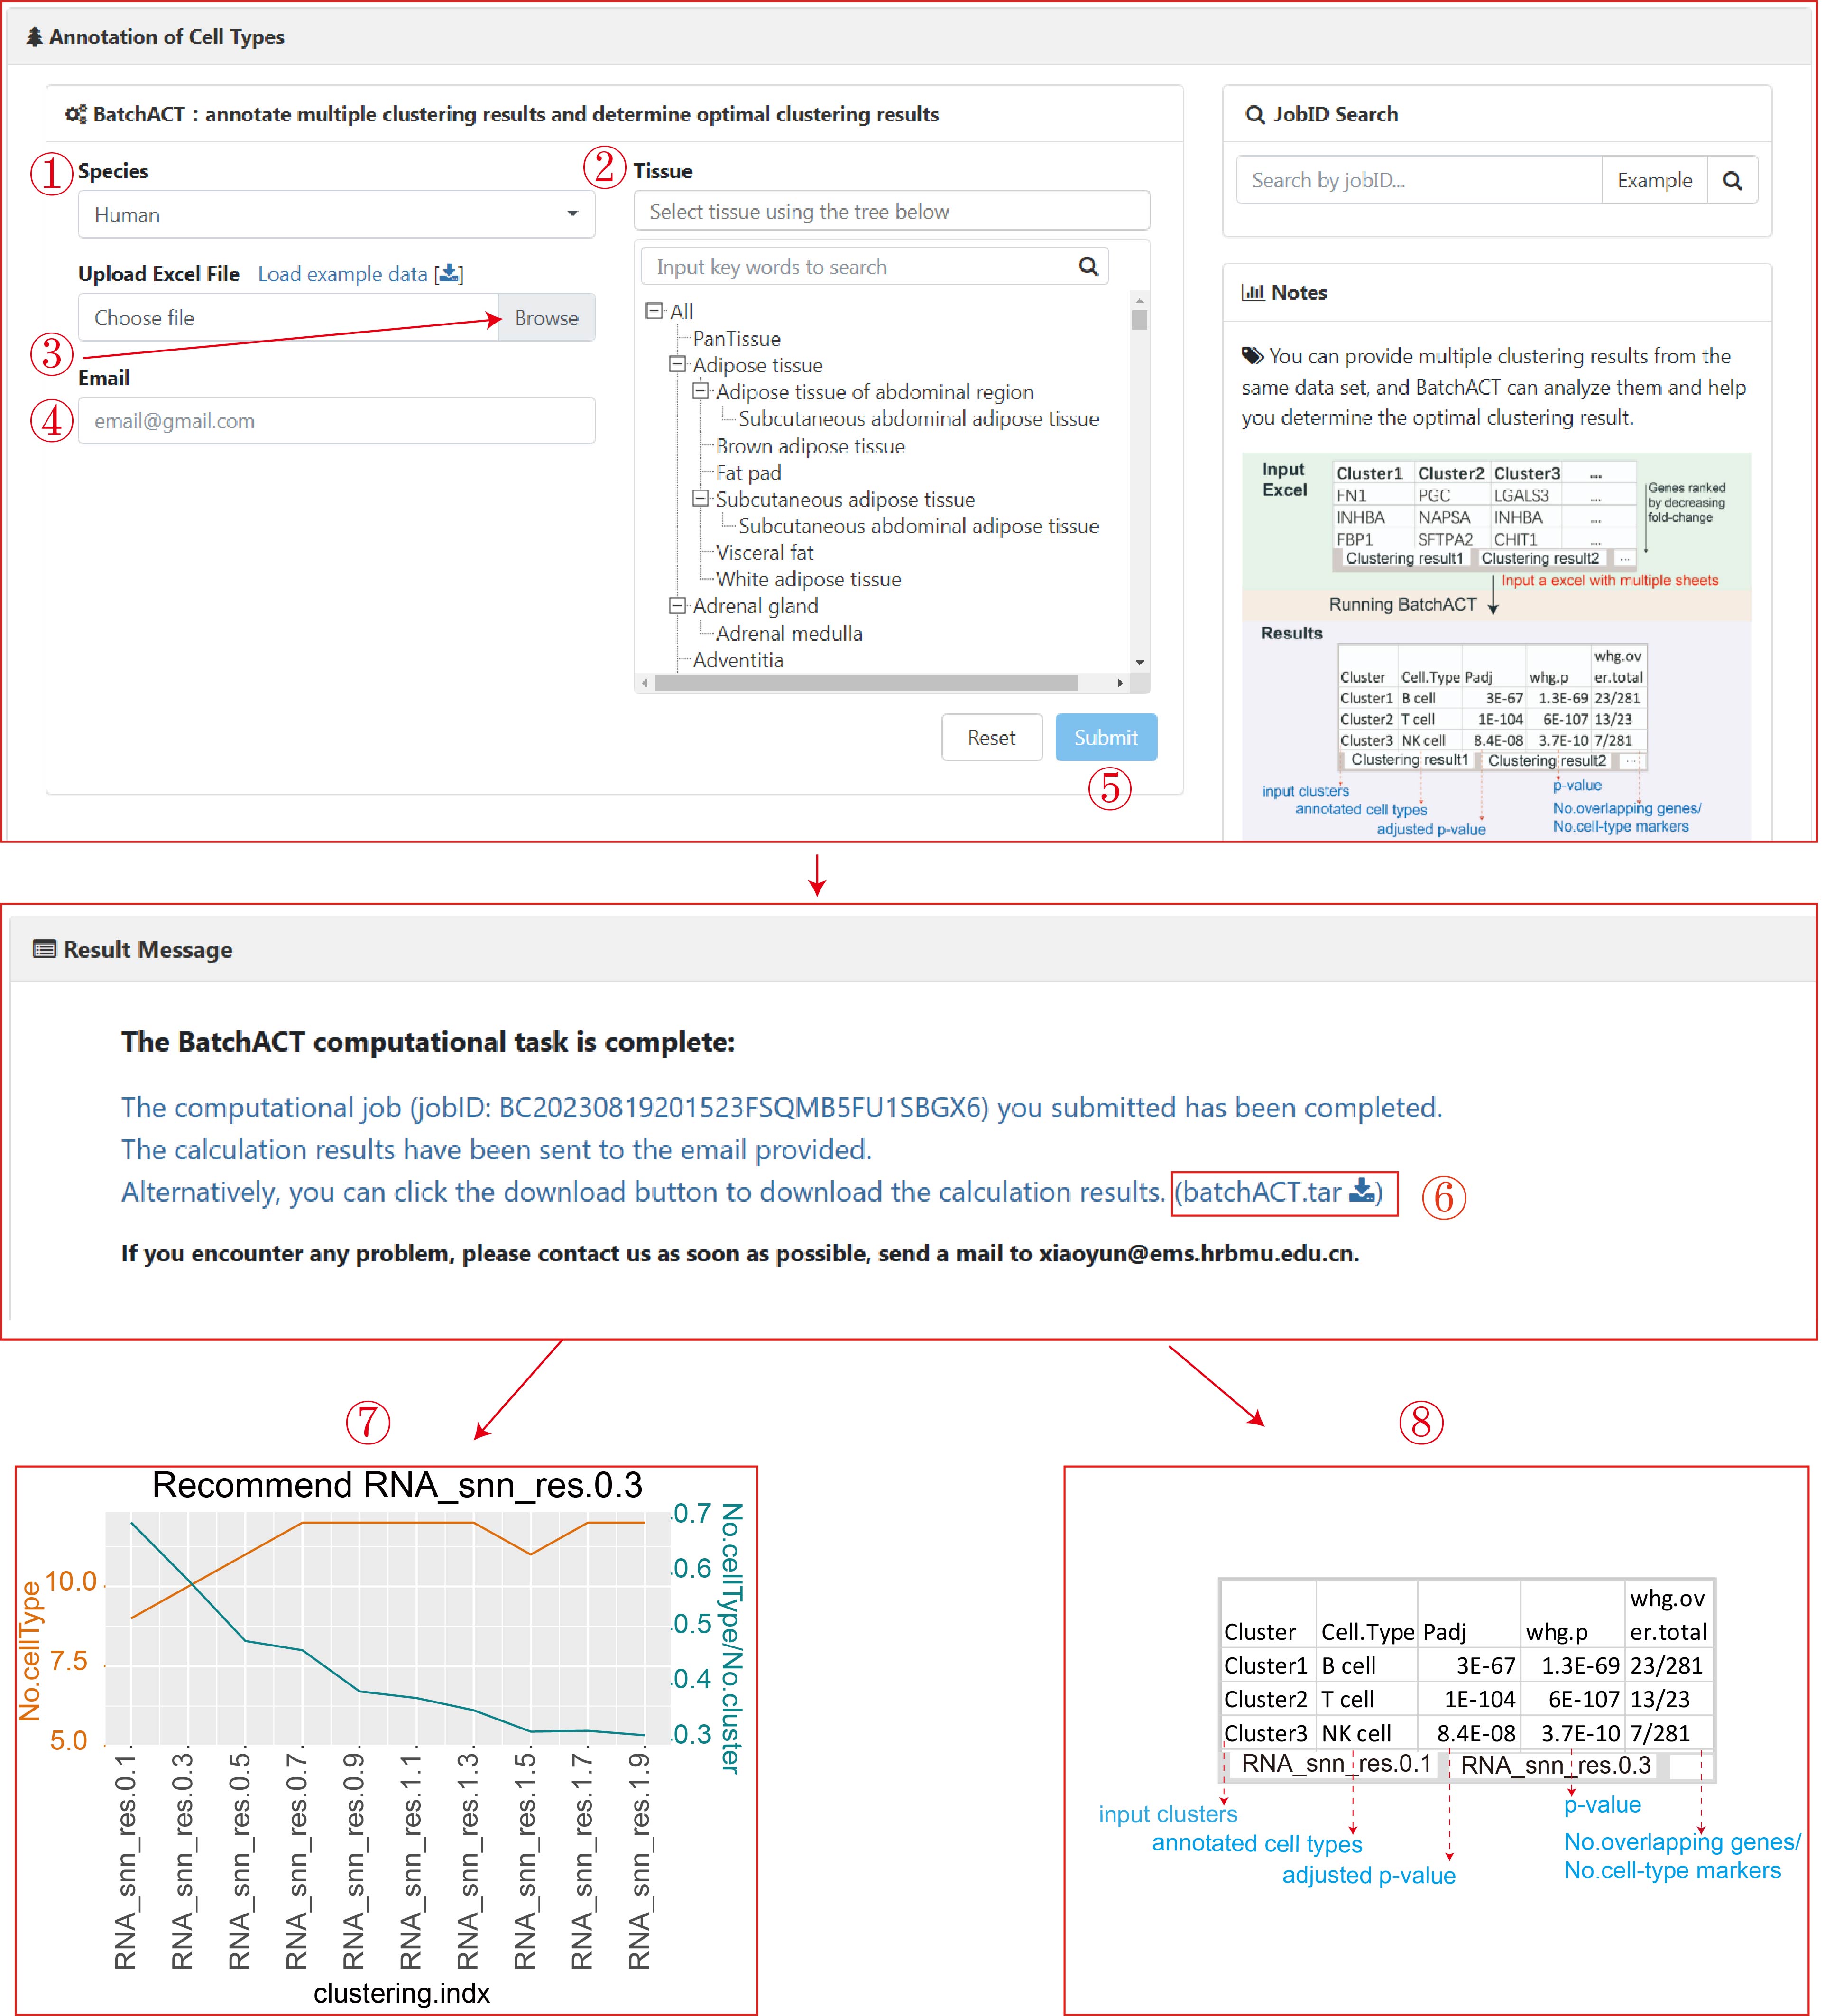
To determine the optimal clustering parameter, users can select the species (1), tissue (2), and upload an Excel file (3) containing multiple (>=2) clustering results, with each sheet representing a specific parameter setting. In each sheet, columns represent upregulated gene symbols specific to each cluster. Users also need to input an email address to receive the analysis results (4). Upon clicking the "Submit" button (5), BatchACT will be initiated. Once the analysis is successfully completed, the web page will redirect to the results page. Users can download the analysis results from the page (6) or receive them via your input email. The results consist of two files:
A graphical representation (the abscissa represents each clustering result) to assist users in determining the best clustering results (7). It includes two metrics for each clustering result: "No.cellType" (number of unique cell types that were annoted) and its ratio to the total number of clusters ("No.cellType/No.cluster"). To identify the optimal resolution, we selected the clustering parameter where the intersection of these two metrics was closest, achieving a balance between under-clustering and over-clustering.
An Excel file containing annotated cell types for each clustering result (8). It comprises five columns: the input cluster names("Cluster"), the annotated cell types ("Cell.Type"), adjusted p-values("Padj"), weighted hypergeometric p-values("whg.p"), and the intersection between the input upregulated genes and the cell type markers ("whg.over.total", the numerator representing the number of intersecting genes and the denominator representing the total number of markers for that cell type).
For the convenience of users in downloading cell type markers specific to human and mouse tissues, we have provided a Download function (1). On the Download page, users can select markers of interest for either human or mouse (2). The cell type marker files for each tissue are arranged alphabetically. In addition to paging through the list, users can also use the search function to locate content related to the tissue of interest (3). Finally, by clicking on the hyperlink, users can download the markers and their corresponding PMID information for various cell types within the respective tissue (4).
